最简单的R程序实例-拟合线性回归分析
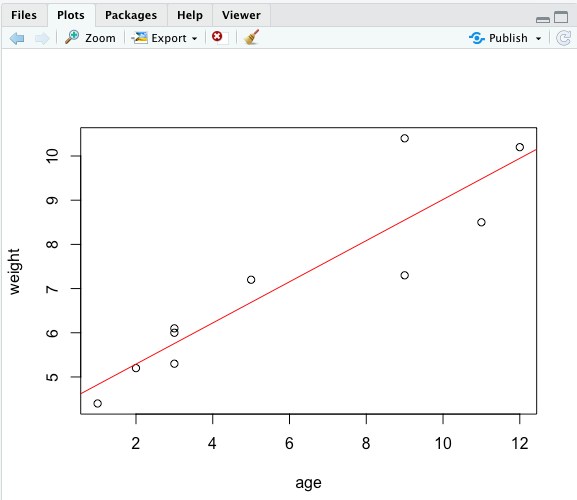
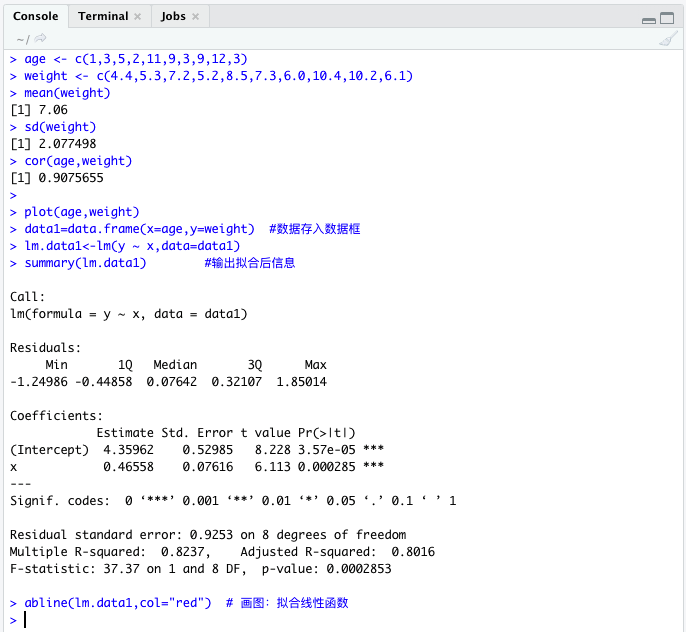
一、先看结果


二、再看源代码
1 2 3 4 5 6 7 8 9 10 11 | |
代码详解:
1~2行,设置数据集。
3:计算weight的平均值
4:计算weight的标准差
5:计算age与weight的相关系数(相关系数在0~1之间,越靠近1,相关性越大)
7:基于age与weight绘制散点图
8:将age与weight存入数据框
9:使用lm函数(后面详解)
10:输入拟合后的汇总信息
11:绘制拟合线
三、函数详解
lm() 函数
lm(formula, data, subset, weights, na.action,
   method = "qr", model = TRUE, x = FALSE, y = FALSE, qr = TRUE,
   singular.ok = TRUE, contrasts = NULL, offset, ...)
formula代表拟合的公式,如Y ~ X,则表示:对因变量Y和自变量X作线性拟合拟合模型为
y = a + bx
lm对象即lm函数返回的值,其属性包括:(控制台输出结果)
> x <- 1:10
> y <- rnorm(10)
> line.model <- lm(y~x)
> names(line.model)
[1] "coefficients"  "residuals"     "effects"       "rank"          "fitted.values"
[6] "assign"        "qr"            "df.residual"   "xlevels"       "call"
[11] "terms"         "model"
常用的有coefficients,residuals和fitted.values,分别表示拟合的得到的各系数的值、残差和预测值。
> line.model$coefficients
(Intercept)           x
-0.08691011 -0.07748115
> line.model$residuals
          1           2           3           4           5           6           7           8           9          10
-0.99596463  1.35205887 -0.96315519  0.10319393  0.13748375  0.01977122  1.46849910 -0.35369933 -0.19446886 -0.57371887
> line.model$fitted.values
         1          2          3          4          5          6          7          8          9         10
-0.1643913 -0.2418724 -0.3193536 -0.3968347 -0.4743159 -0.5517970 -0.6292782 -0.7067593 -0.7842405 -0.8617216
可以看出该拟合曲线为y=-0.08691011 -0.07748115x
其他值的调用,包括p值,给定x预测的y值,拟合系数R方等需要通过summary函数调用,例如:
1. 计算p值
> f <- summary(line.model)$fstatistic
> pf(f[1], f[2], f[3], lower.tail=F)
    value
0.4549477
给定x预测相应的y值(给定0,1,2 预测出的预测值如下)
> predict(line.model, data.frame(x=c(0, 1, 2)))
          1           2           3
-0.08691011 -0.16439126 -0.24187241
2. 拟合系数R平方
> summary(line.model)$r.squared
[1] 0.07155641
> summary(line.model)$adj.r.squared
[1] -0.04449903
也可以直接通过 summary(line.model) 打印出大部分与回归直线相关的一些结果
> summary(line.model)

Call:
lm(formula = y ~ x)

Residuals:
     Min       1Q   Median       3Q      Max
-0.99596 -0.51871 -0.08735  0.12891  1.46850

Coefficients:
            Estimate Std. Error t value Pr(>|t|)
(Intercept) -0.08691    0.61226  -0.142    0.891
x           -0.07748    0.09867  -0.785    0.455

Residual standard error: 0.8963 on 8 degrees of freedom
Multiple R-squared:  0.07156,   Adjusted R-squared:  -0.0445
F-statistic: 0.6166 on 1 and 8 DF,  p-value: 0.4549